Paper and fine art
Newsroom Paper Collage
Halftone photo cutouts layered as a deep paper diorama on aged newsprint, with giant stat numbers and one hot accent.
200 free credits at signup. No credit card required.
Newsroom Paper Collage scenes
What Newsroom Paper Collage is good for
Finance and economics creators, newsletter writers turning essays into video
Economics and money explainers
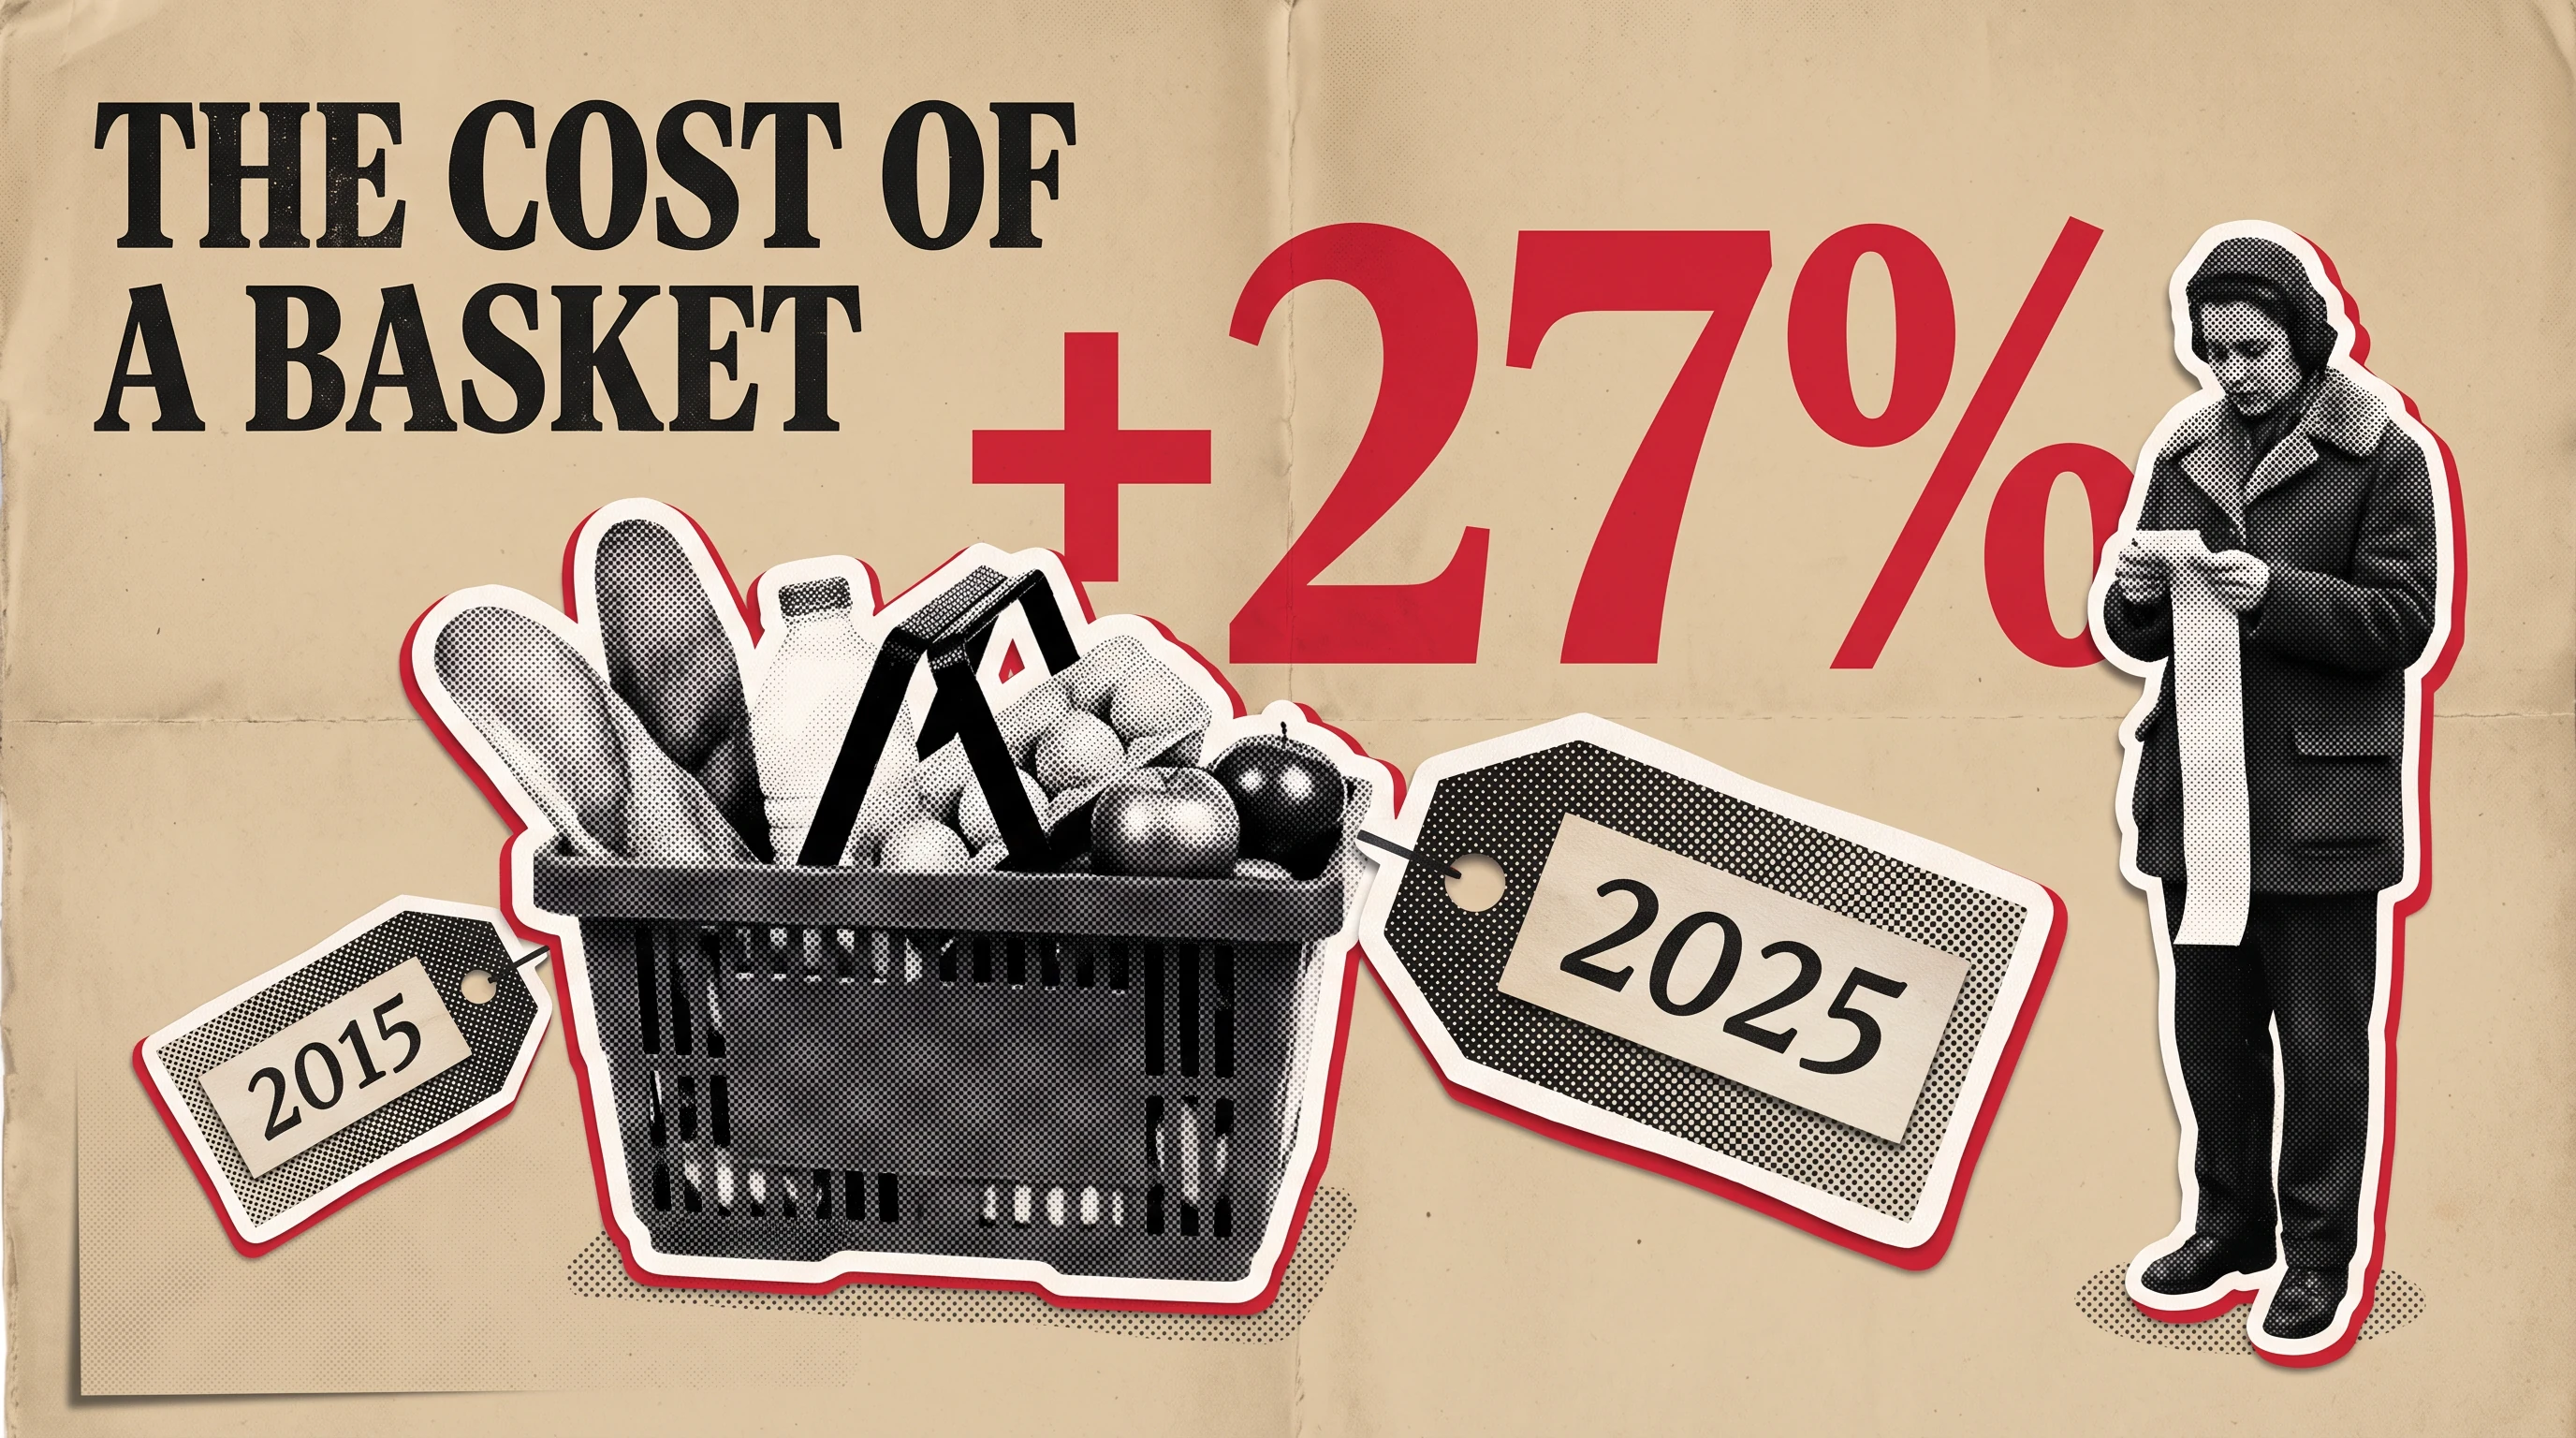
Long-form breakdowns of markets, prices, debt and trade where every beat lands on one number. Giant stat numbers tick up in the hot accent while halftone cutouts of the people involved stand around them, and metaphor dioramas (a pump inflating a balloon, a scale tipping) make abstract forces physical.
- Why a grocery basket costs more every year
- How a single trade deal reshaped a region
- Who actually pays a tariff
- The bubble cycle, from boom to bust
History channels, documentary creators, educators
History and documentary storytelling
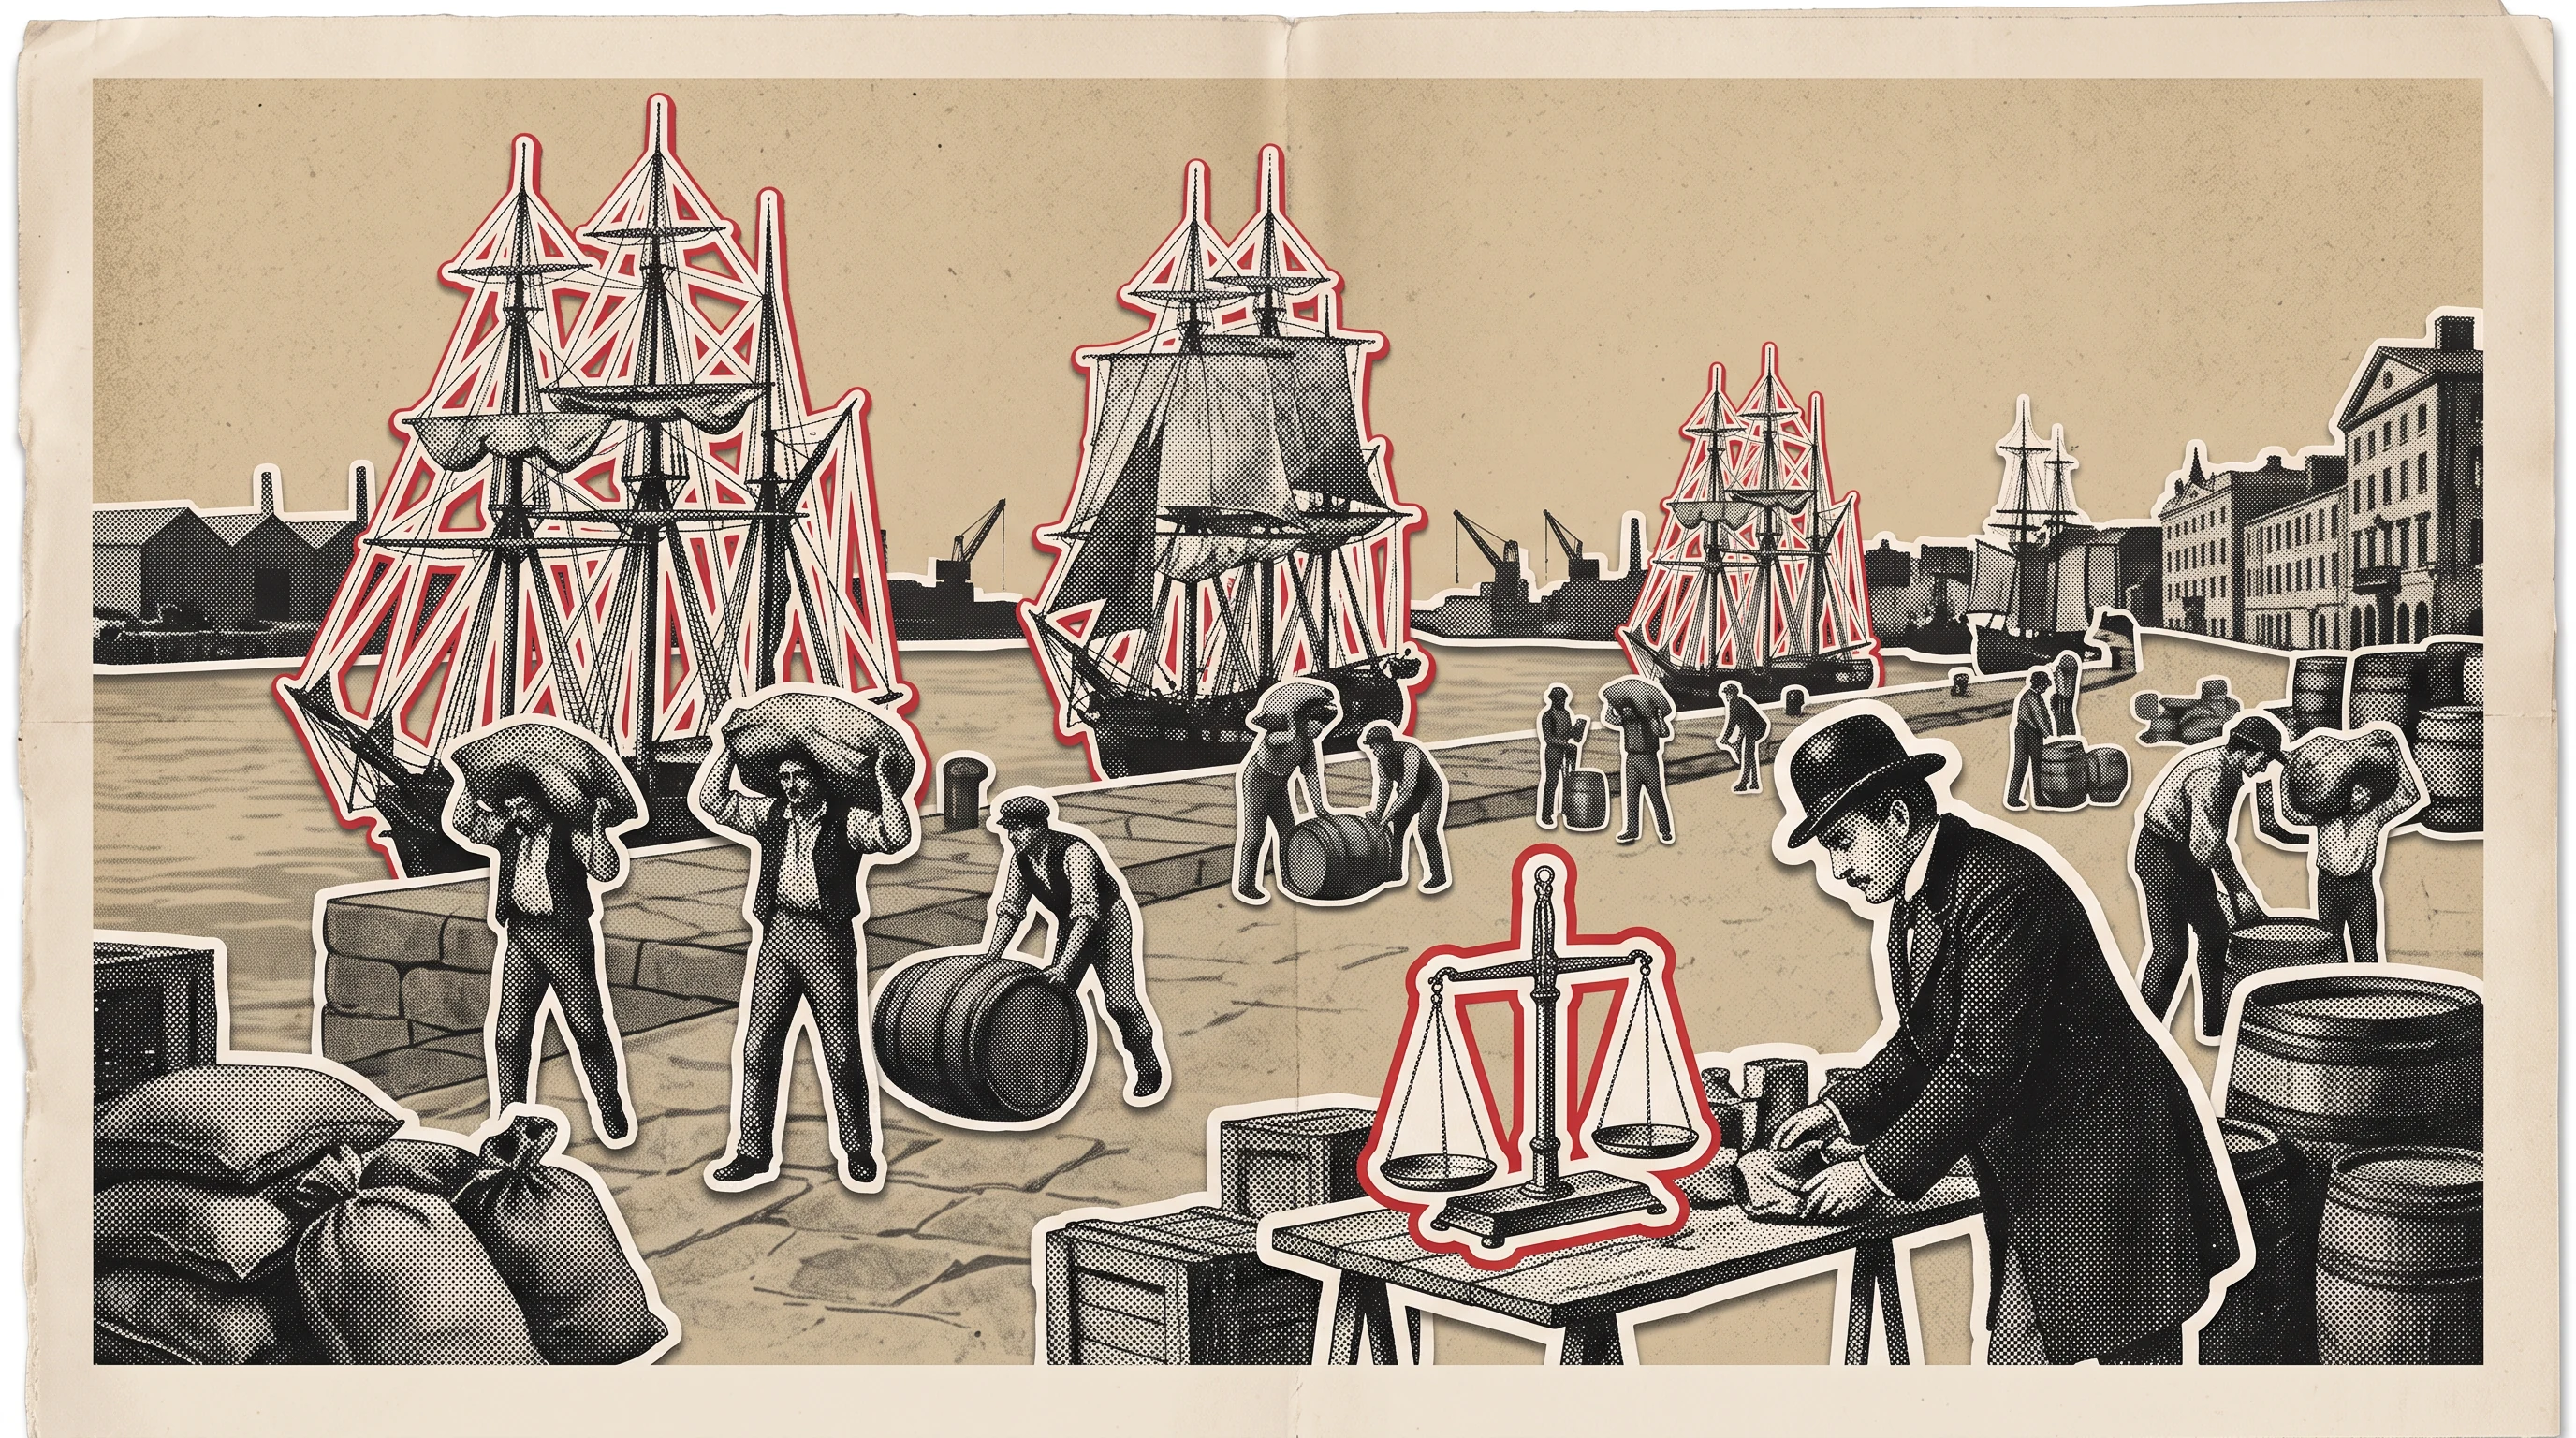
Narrated history told through archival looking cutouts, folded maps, pins and torn headlines. The recurring world map stage anchors chapters, and the camera flying between paper layers carries the viewer from one decade or place to the next without breaking the page.
- The rise and fall of a trading empire
- How a border was drawn on a map
- A century of one city in ten minutes
- The story behind a famous treaty
Political commentary creators, think tanks, advocacy groups
Policy, politics and current affairs
Explaining laws, elections and public decisions with an authoritative newsroom feel. Short headline strips and single statistics carry the argument, alert washes mark the turning points, and cutout figures stand in for the institutions and people involved without drawn caricature.
- How a bill becomes law, and where it stalls
- What a rate decision means for renters
- Why voter turnout differs by region
- The real cost of a public program
Business creators, analysts, companies publishing thought leadership
Business and industry analysis
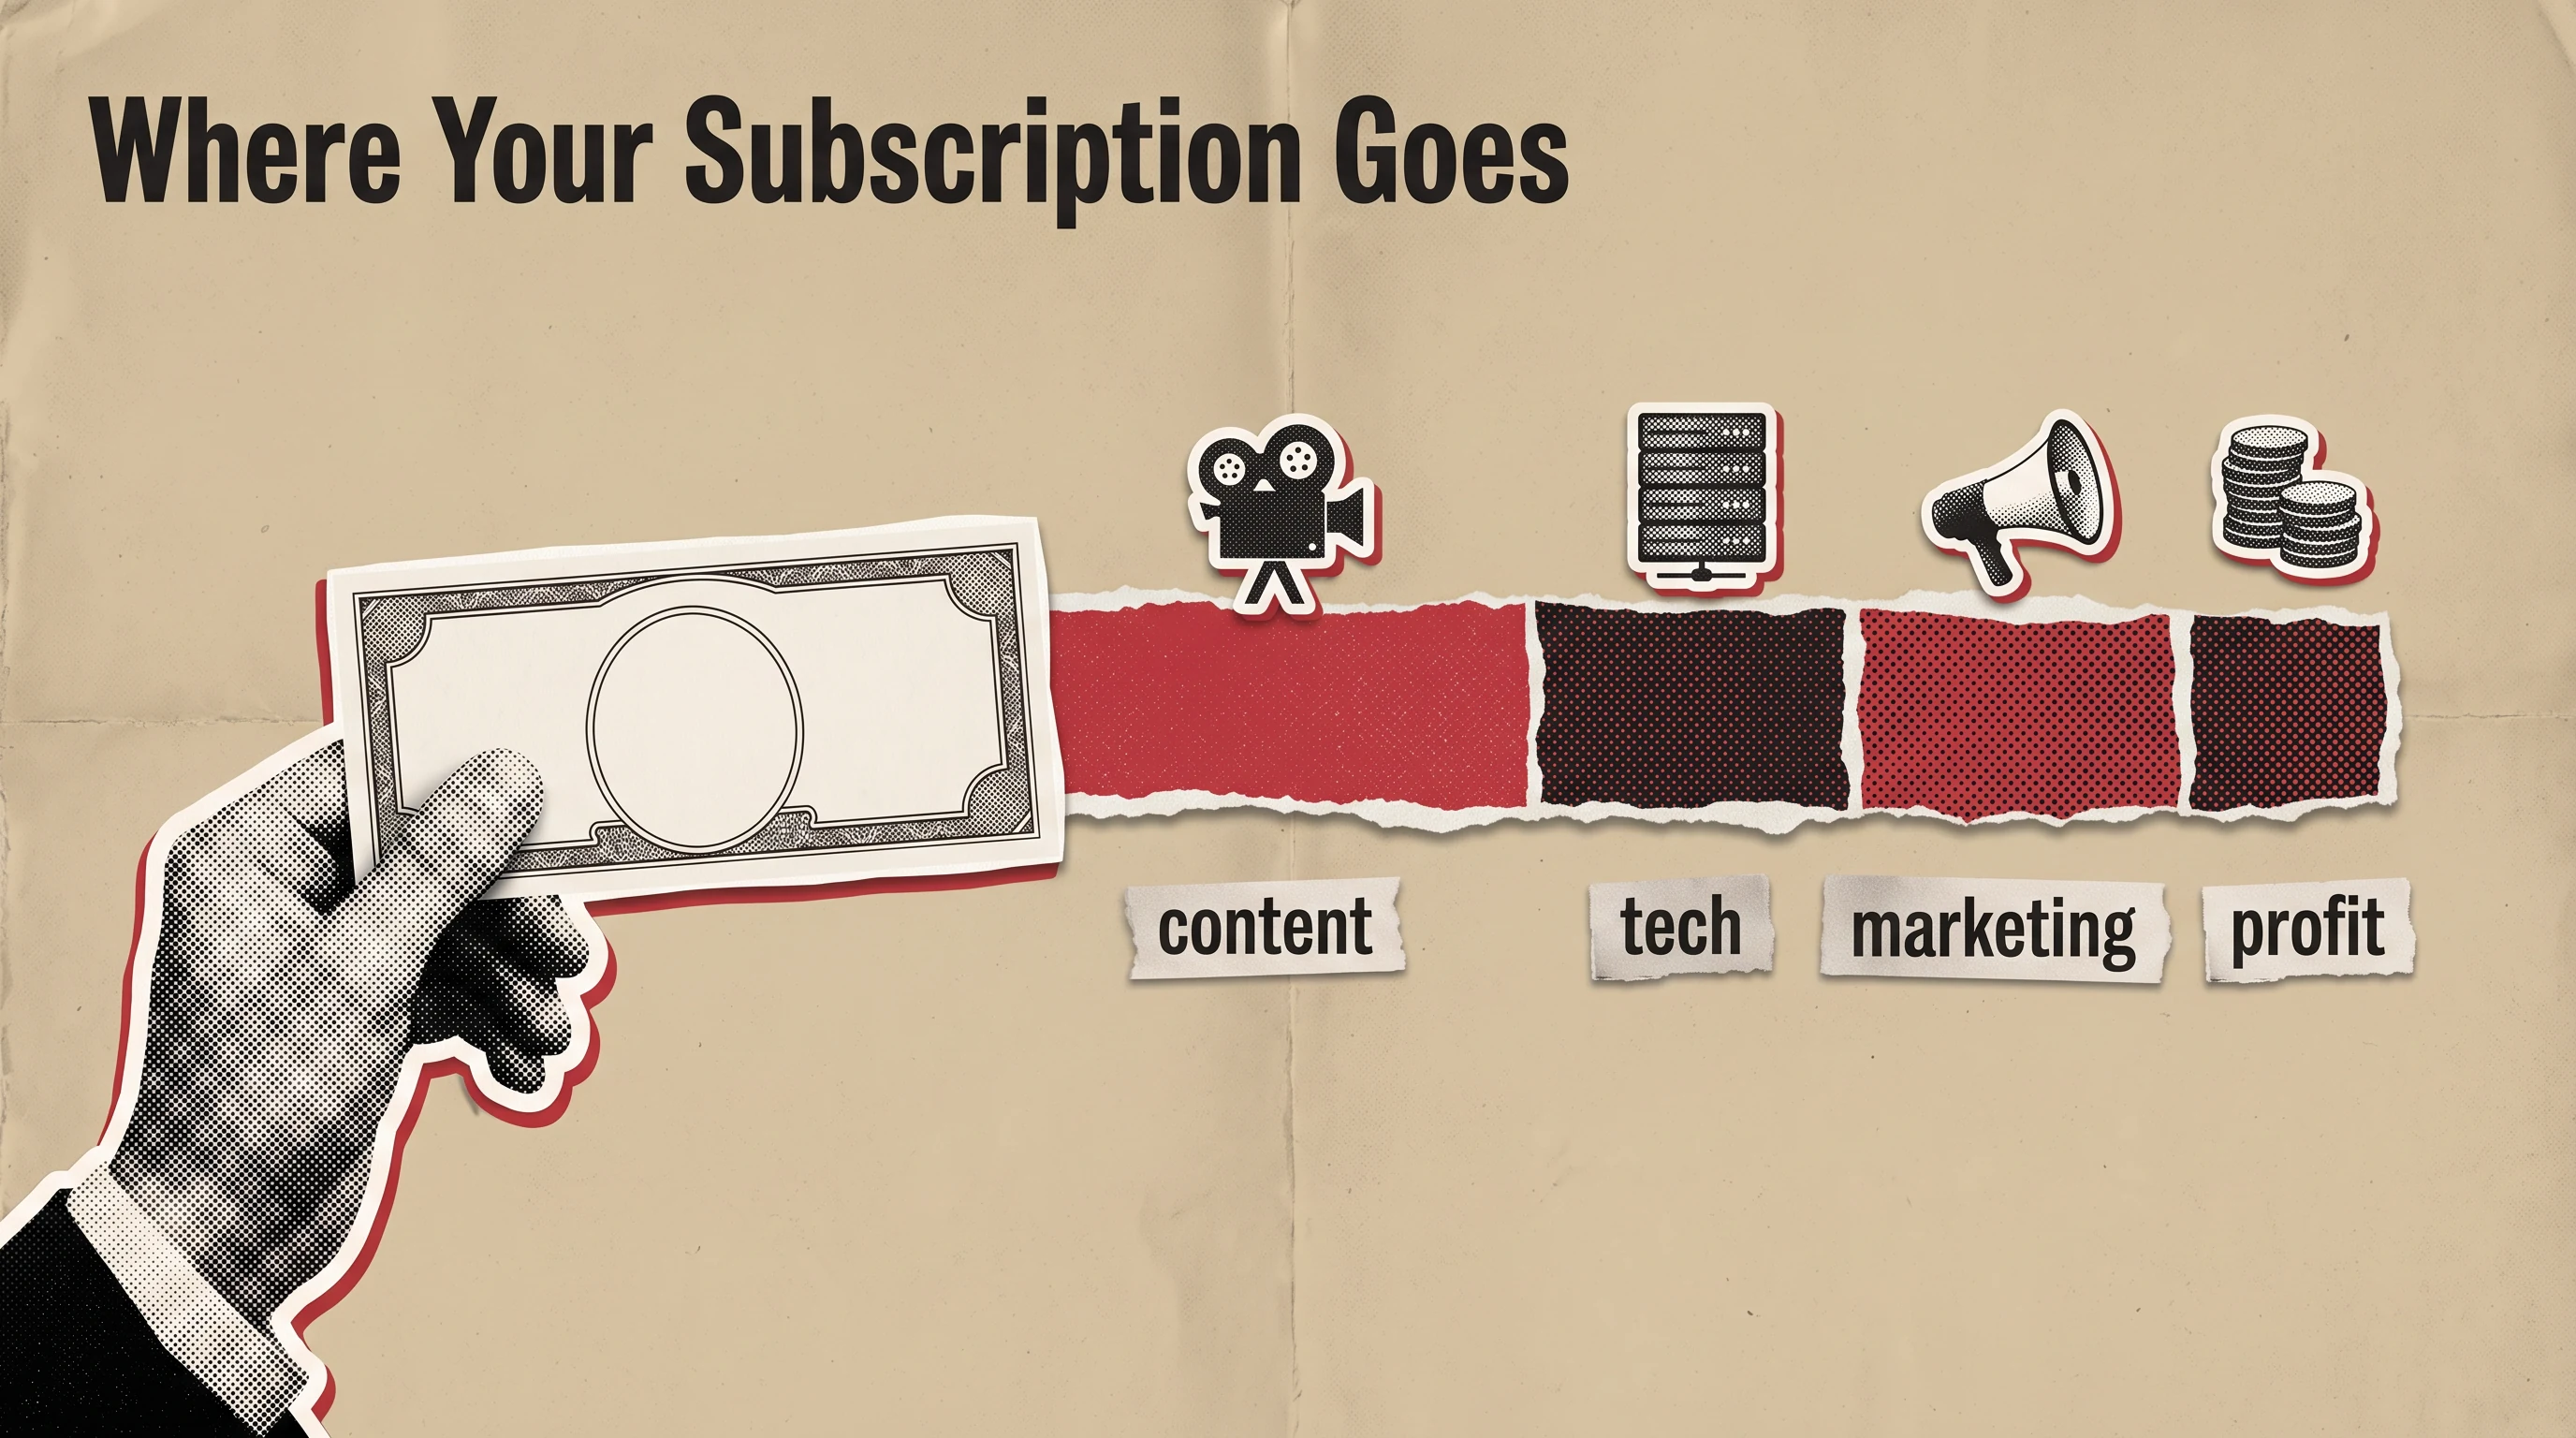
Deep dives into how companies, industries and supply chains work. Metaphor dioramas show money flowing between players, triangles of partners and pipelines of goods, while giant figures make market sizes and margins land one at a time.
- How three companies control one supply chain
- Where the money goes in a streaming subscription
- The economics of a budget airline
- Why a merger was blocked
Data journalists, researchers, nonprofits sharing findings
Social science and data journalism
Turning survey results and studies into a narrated story about people. Halftone crowds, single portraits and one hot accent number per beat keep the data human, and pull back reveals show how one person fits into the whole population.
- What a national survey says about work and happiness
- How housing costs changed a generation
- Migration patterns across fifty years
- Findings from an annual impact report
Palette
Tags
More paper and fine art styles
See all paper and fine art styles





Make your explainer in Newsroom Paper Collage
Paste a script or describe your topic. Scenema writes the narration, designs every shot in this style and animates the whole video.
Make a video in this style