Motion graphics
Editorial Data Charts
Bold, beautifully annotated newspaper style charts on newsprint, with one red highlight telling the story.
200 free credits at signup. No credit card required.
Editorial Data Charts scenes
What Editorial Data Charts is good for
Finance creators, banks and economics educators
Personal finance and economics
Money maths and economic trends made clear with honest, well labelled charts.
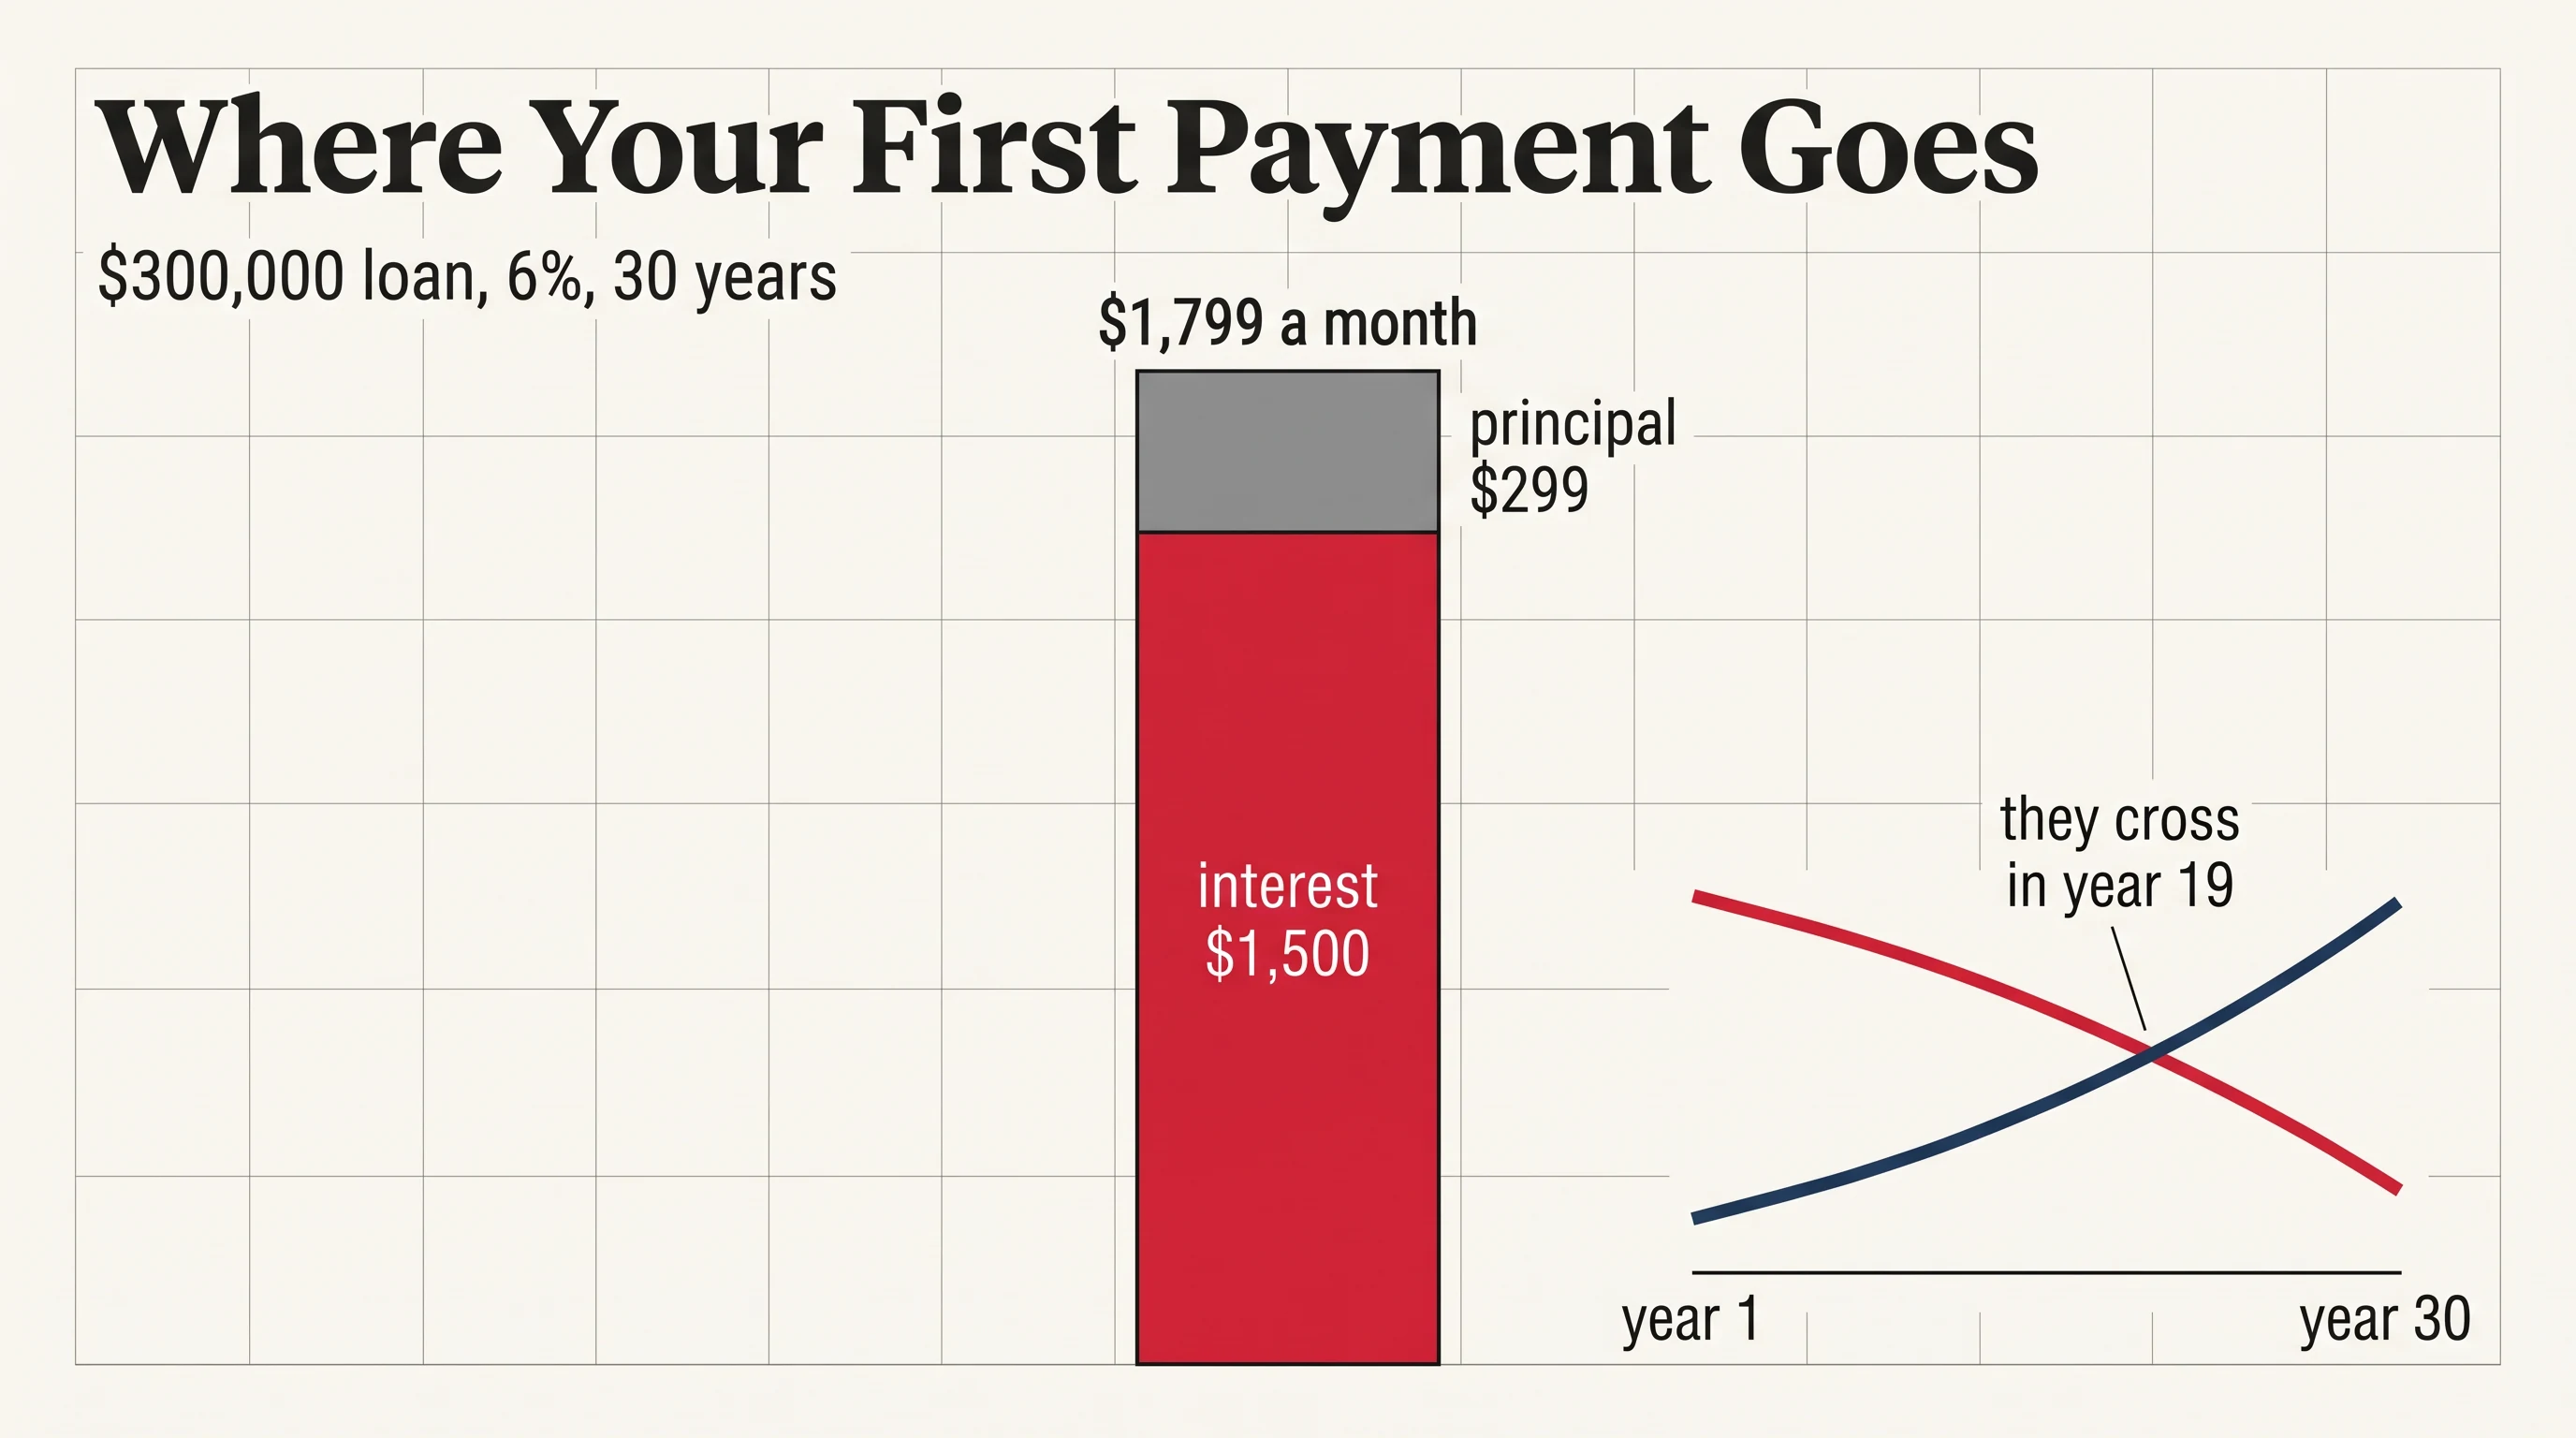
- Where your first mortgage payment goes
- How inflation eats savings
- Why prices rose faster than pay
- How interest rates work
Newsrooms, analysts and explainer channels
Data journalism and current affairs
Turns a dataset into a story with one clear point per chart.
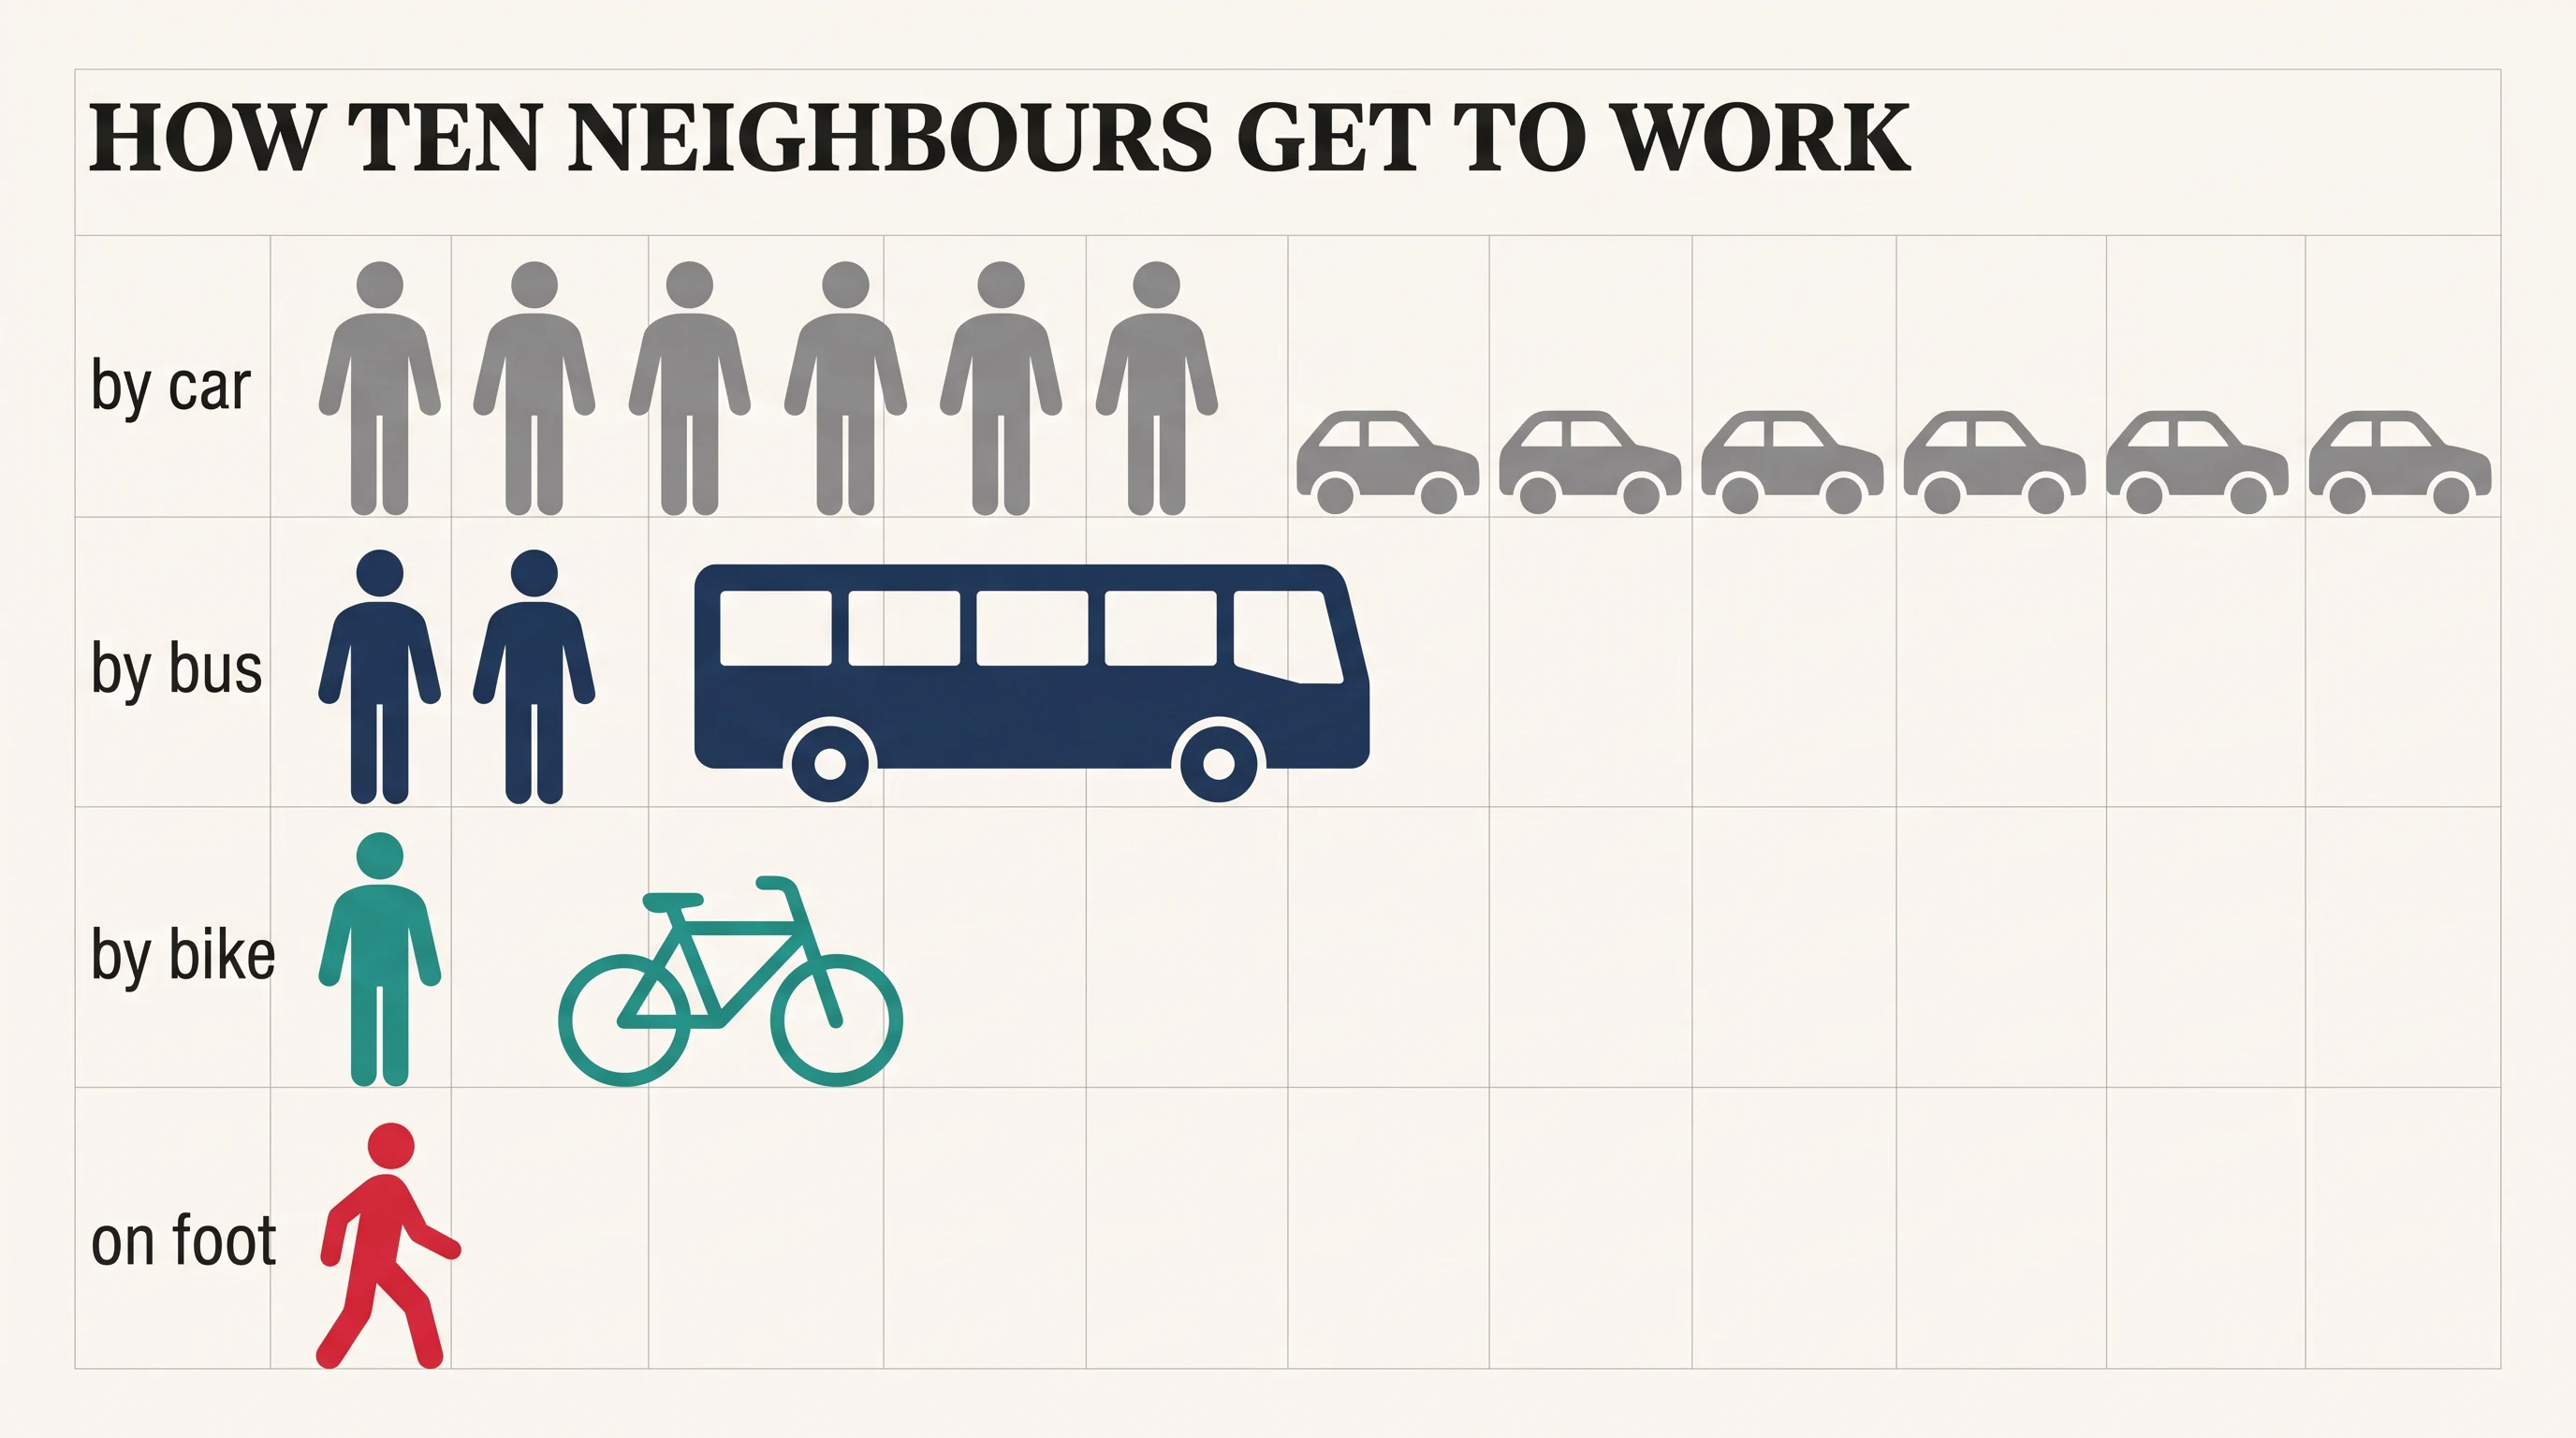
- How people get to work
- Who pays the most tax
- How life expectancy has changed
- Where the money goes in a city budget
Companies, nonprofits and investor relations
Reports and results
Annual results, survey findings and impact numbers presented with editorial polish.
- Our year in numbers
- Survey results explained
- Quarterly results
- Our impact report
Science educators and nature channels
Science and nature by the numbers
Comparisons that surprise, with silhouettes that make the data memorable.
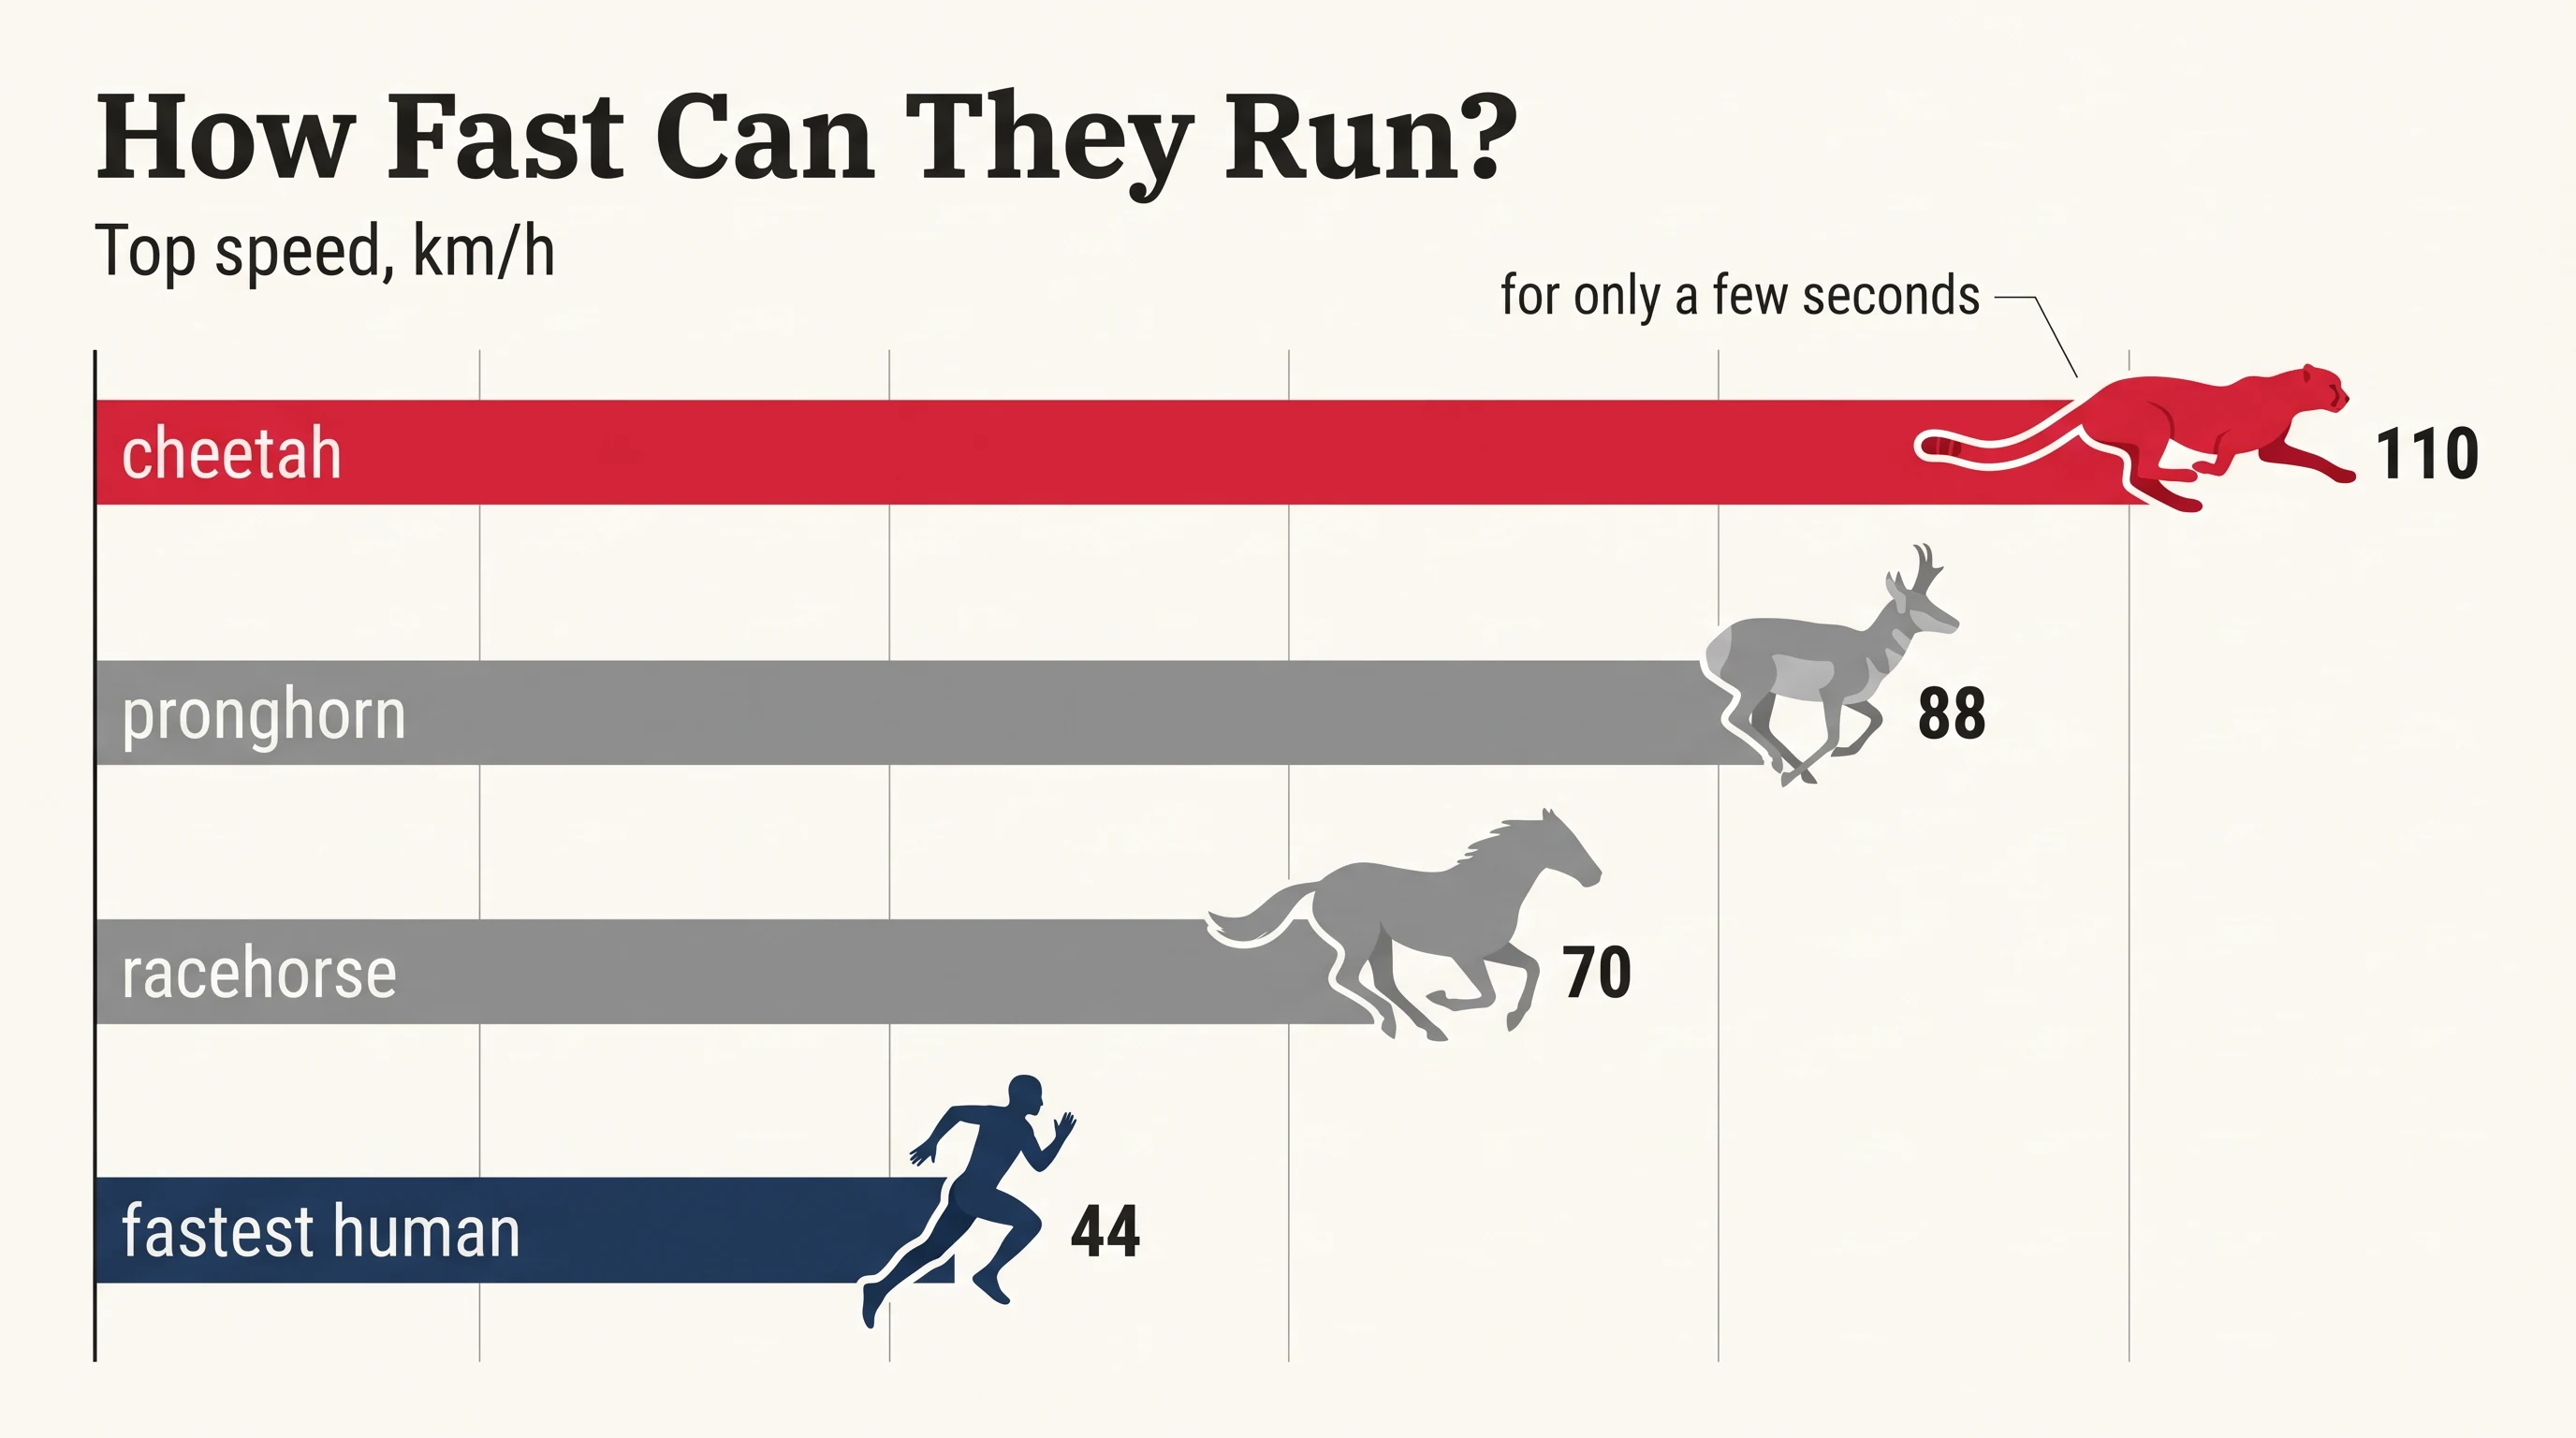
- How fast can animals run
- How big is a blue whale
- How much water we use
- How the planet has warmed
Teachers and course creators
Education and statistics
Teaches reading charts and statistics with clean, labelled examples.
- How to read a line chart
- Averages versus medians
- Understanding percentages
- Correlation is not causation
Palette
Tags
More motion graphics styles
See all motion graphics styles

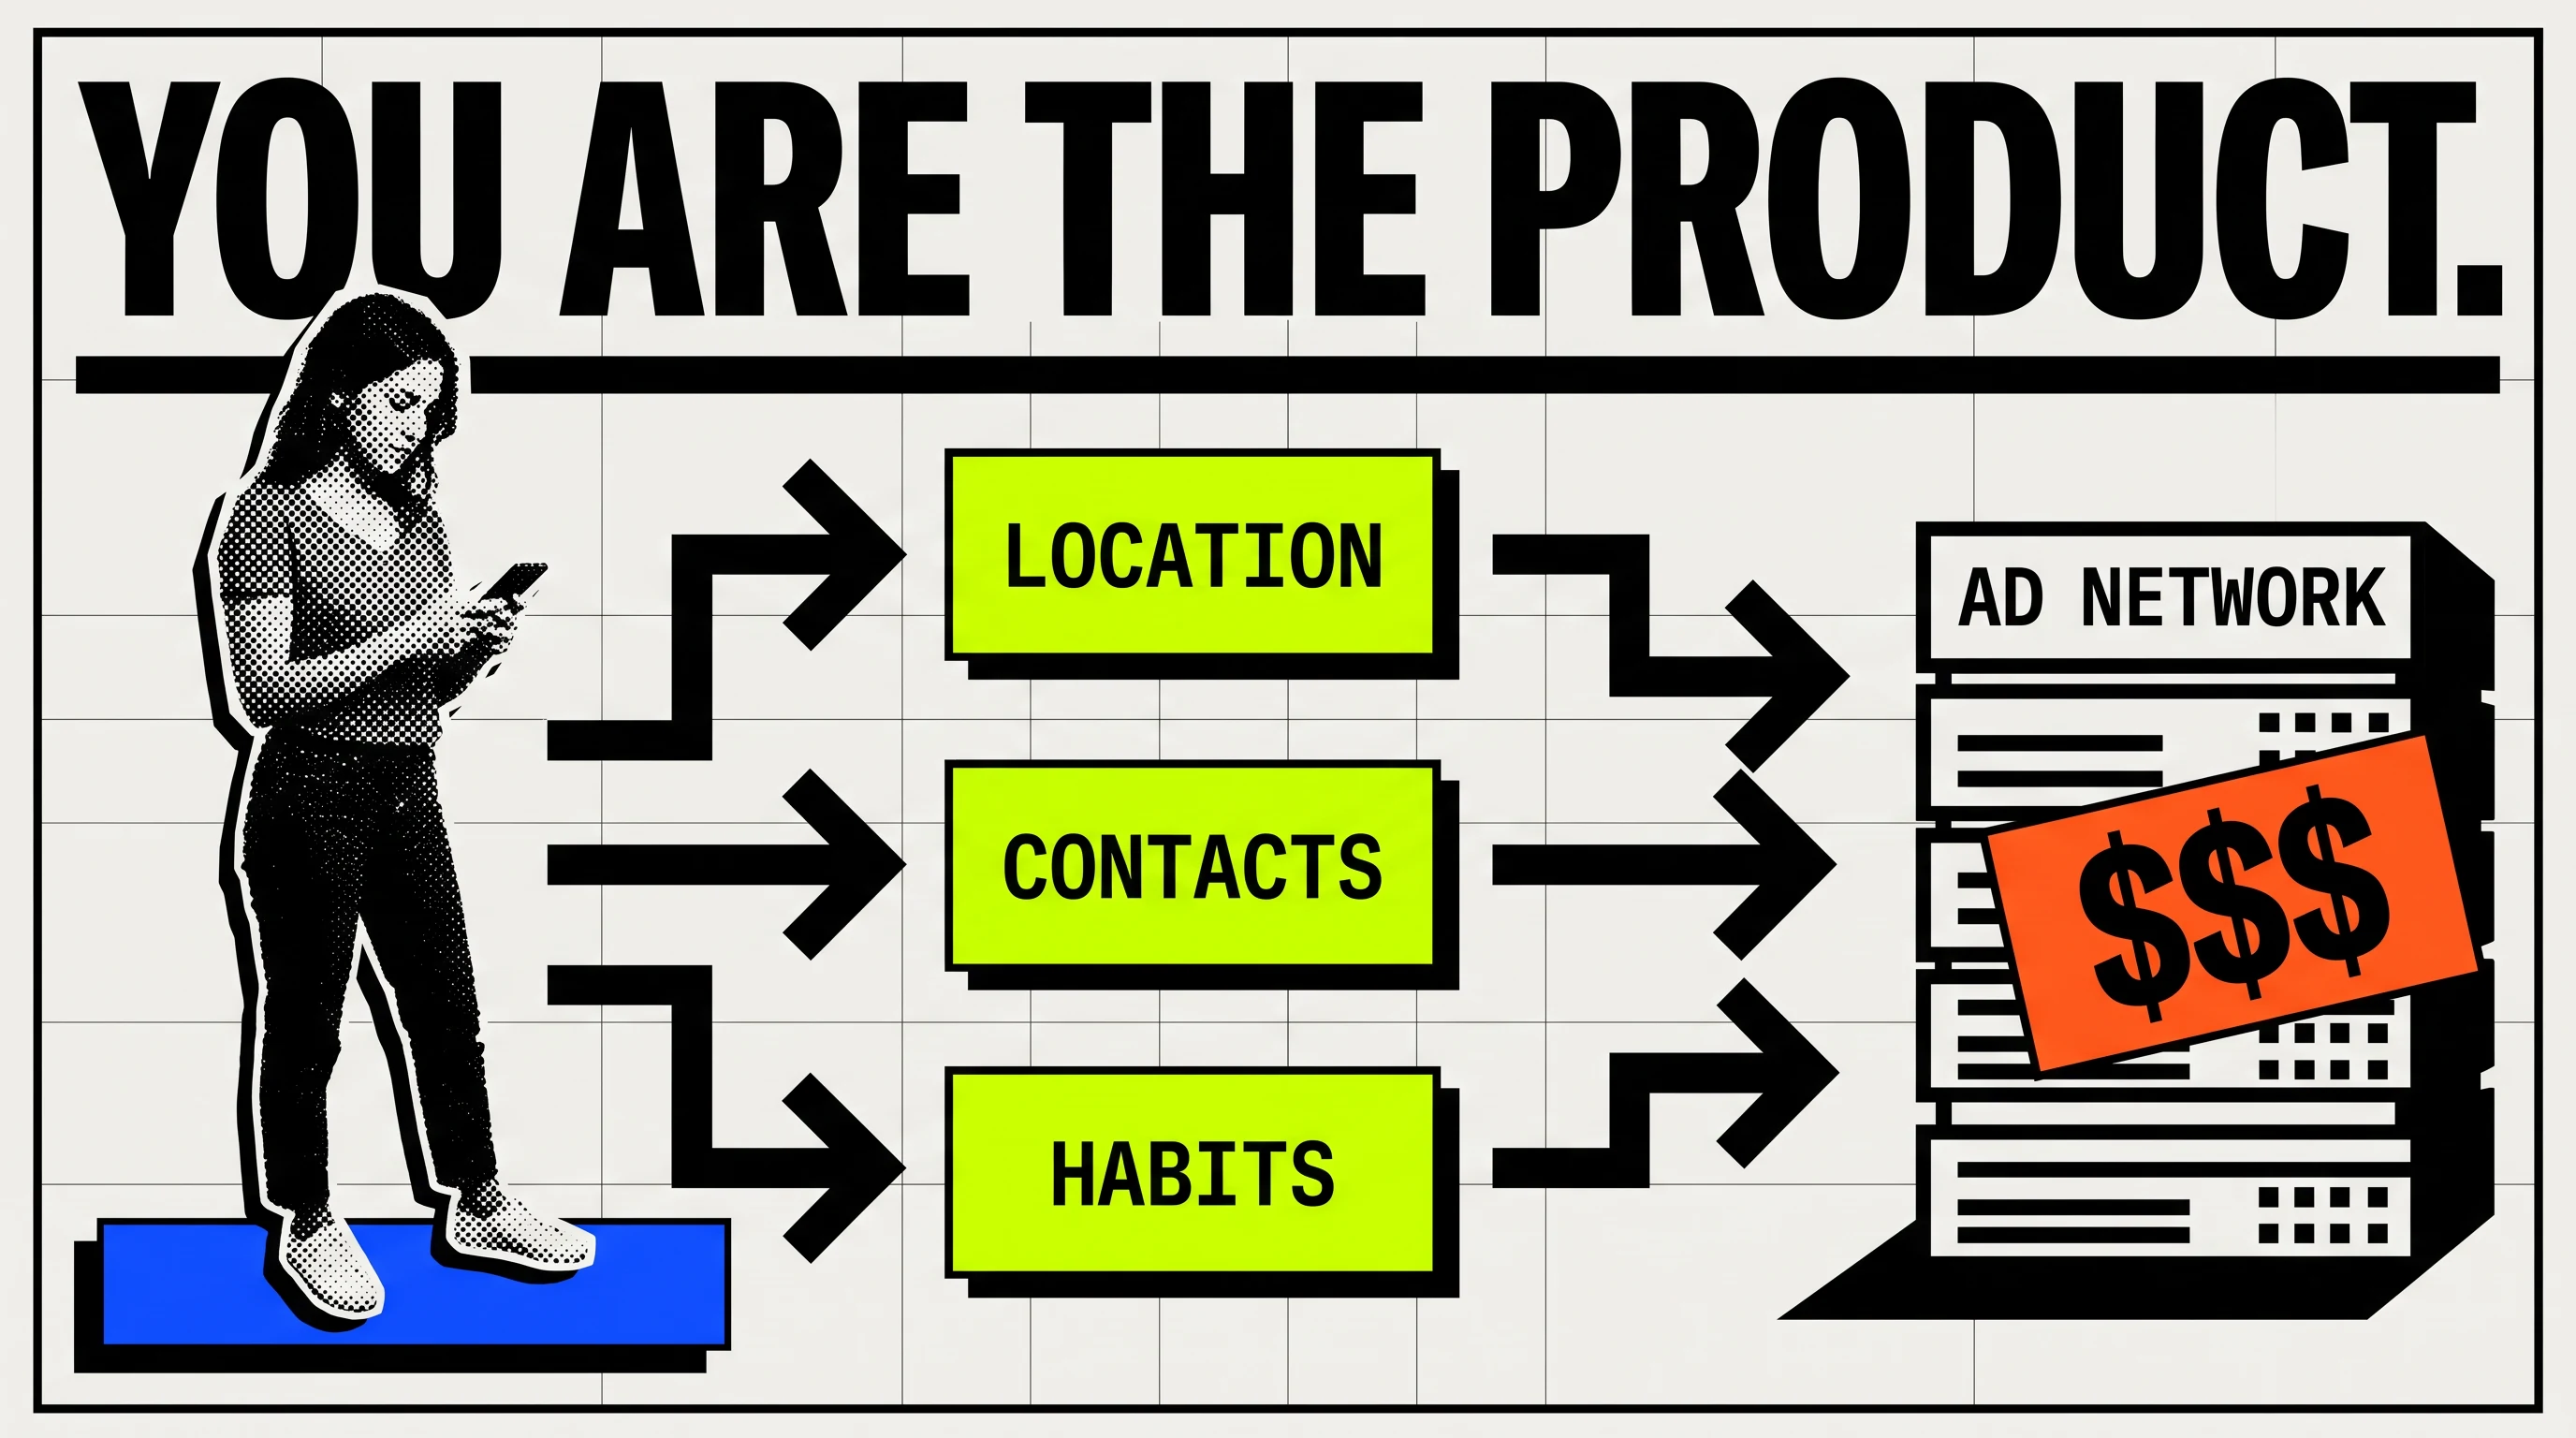



Make your explainer in Editorial Data Charts
Paste a script or describe your topic. Scenema writes the narration, designs every shot in this style and animates the whole video.
Make a video in this style